Untangling housing: rates and demographics
For the purveyors of doom, the US housing market is Exhibit 1A. But the sector is stronger, and the demographic winter of 2000 to 2010 has passed.
In a surprise to no one, housing activity slowed to a crawl, as interest rates rose in the United States, and around the world. Indicators such as mortgage applications, and months of inventory, relative to sales, point to a market that is weaker than observed in the financial crisis of 2008. But in the last year, DR Horton, America’s largest builder, is flat relative to the S&P 500, and over the last six months, it’s 20% higher. The industry ETF, XHB, highlighted here, has also out-performed the S&P 500 since early May.
In the investor’s eye, it’s a tangle of knotted threads. For many, a tangle that is best left alone, or seen as the seeds of wider despair. Does it require a Gordian solution, akin to cutting the threads and beginning again? Or is there a simpler, less disruptive way out of the current mess?
The Short-Term
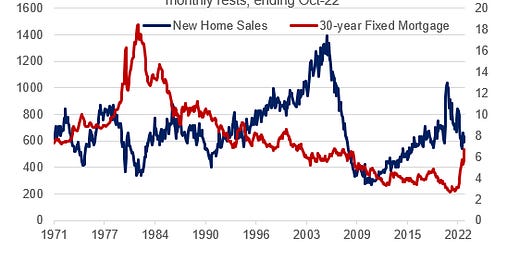
The short-term disruption to the US housing market as mortgage interest rates rise has been profound. New home sales are down 37% from their peak in 2020. Mortgage refinances are down 81% from a year ago, and new home mortgage applications are down 41% from a year ago.
The decline in housing activity from purchases is feeding through into lower building activity1. New home starts are down close to a third.
There have also been price declines. But as data from Altos Research shows, these price declines are within the broad range of outcomes expected from seasonality. It will be next spring before the market understands the impact of rate rises on prices.
What happens to the financial system?
The first question this decline in activity raises is its impact on the financial system. The Global Financial Crisis began with the US housing market. The consequences of slower activity, price declines, and indebted households had a lasting impact on the entire world.
This housing slowdown is different. Adjustable-rate mortgages are a smaller share of the market than was the case in 2007. Latest data put adjustable-rate mortgages at 10.8% of home loan applications, compared to over 30% prior to the financial crisis. In the last two years, the share of adjustable mortgages fell as low as two or three per cent.
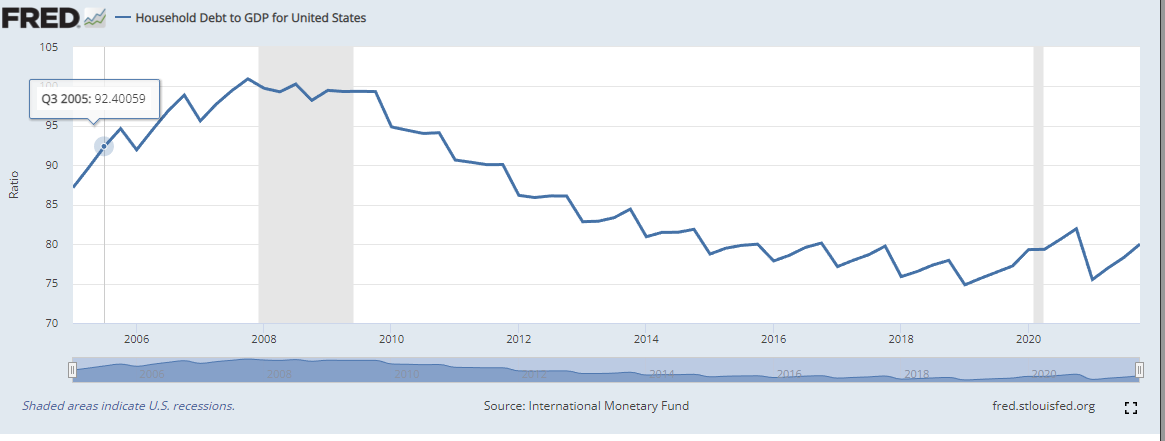
It’s also the case that household debt in the US has fallen steeply in the wake of the financial crisis. US households, as described here, are scarred by the experience of 2007 to 2009 and have adjusted their behaviour accordingly.
The risk of a housing crash leading to a broader financial crisis is currently low. This, partially, explains current valuations for US homebuilders.
The Muddle Through
The other aspect of home builder stability reflects the belief that the market is now, well and truly, in the muddle through phase. To quote Churchill, “It is not even the beginning of the end. But it is, perhaps, the end of the beginning.” The length of this phase, characterised by slow activity and stable-ish prices, will determine the next stages of the US housing market.
Ending Muddle Through
Resolution of the muddle through phase, such that home sales, starts, and prices trend higher, requires clarity around mortgage rates, and housing prices. There are a couple of important points to make about mortgage rates.
First, the demand for adjustable- rate mortgages has increased. As mentioned above, adjustable-rate mortgages are becoming a bigger part, of a smaller pie. These five-year rates are approximately two hundred to two hundred and fifty points lower than those for thirty-year. This is lowering initial mortgage costs.
Second, the best, historic, time to buy a house has been at the peak of the interest rate cycle. This is the point of maximum despair. As rates begin to decline, mortgage payments fall, and more buyers enter the market. The recent decline in mortgage rates, aligned with core inflation falling, suggest a peak may have been achieved. Buyers now are getting the best of the potential deals.
This leads to the second leg of the problem, prices. The increase in homes for sales, relative to monthly sales, disguises the slow pace of growth in underlying inventory. Current inventory, like sales, and starts, is around a third lower than the four-year average. Most likely, prices won’t adjust too much lower because there is little to force sales.
A fall in mortgage rates will end the period of muddle.
The structural story: the demographic winter has passed
The structural story reflects the productivity improvement outlined in May, and a demographic story.
The productivity story is summarised below:
These demographic shifts reflect push and pull factors that improve the productivity of migrating households. Households in the traditional big cities and surrounding suburbs, Chicago, New York and Boston, are faced with higher taxes, longer commutes, and crowded infrastructure. By contrast, migrating households are moving to lower tax, and less dense states. In addition, the strength of demand for service sector jobs and work from home opportunities means incomes remain relatively high. Cities were emptying before Covid. Covid has accelerated the trend.
The demographic argument is as important as the productivity argument.
In the wake of the Baby Boom, and other social changes, the live birth rate in the United States declined from 4.30 million in 1957, to 3.14 million in 1974. From 1974 to 2007, live births rose to 4.27 million.
This is important because it goes some of the way to explain the 2007 housing market bust. In 2021, the average age of a first time homebuyer in the United States was 33. In 2007 it was 32. In 2007, the birth year of the average first homebuyer was 1975; one year from the absolute low in live births since the Depression.
Currently, the market is cycling through the first, post-1974, peak of four million births from the early 1990s. This demand will peak in 2026 and accelerate again in 2030. These homebuyers, with relatively little debt, should prove resilient, as the initial caution over the direction of mortgage rates wanes.
The chart below lays this out. It’s likely that this is a strong explanation for the 2000s. The home building and financing industries lacked natural customers. To increase demand, in a cyclically weak period, financial products were designed to make housing more affordable and expand market size. As economists have been want to say “there’s no such thing as a free lunch”; expanding the market, increased the risk.
This demand weakness has passed.
The homebuilders
The demographic winter of the first decade of this millennium has paved the way for a stronger homebuilding sector in the United States.
Importantly, leverage has come out of the sector. The core client demographic, the US household, has de-leveraged. The companies themselves have leverage ratios of around 20%, and will purchase a large share of their land through options, rather than outright.
For instance, DR Horton, Lennar, Pulte, and Tri-Pointe Homes have lowered debt to equity ratios from over 1x to closer to 0.2x to 0.3x. All of them have expanded their cash on balance sheet, most considerably during the pandemic. This provides them with the balance sheet strength to see through the current market conditions.
The challenge is to determine the right price to pay for these companies.
Dependent upon size, the homebuilding stocks trade on 3x-6x this year’s earnings. It’s likely that this year’s earnings, however, prove to be a short-term peak in the current, longer cycle.
If a 50% decline marks the cycle low for homebuilding earnings, current valuations seem attractive. This would be equivalent to a PE of 6-12x 2023 cycle low earnings. This seems an attractive entry point for a sector that will grow steadily on strong productivity and demographic trends through most of the current decade.
Conclusion
Homebuilding is the interest rate sensitive sector. This year’s disruptions made it a target rich environment for the short-sellers. It’s resilience, particularly since mid-year, must be a surprise to many.
The sector has proved resilient through a combination of its financial strength, the lessons learned from the Global Financial Crisis, and an increase in demand due to productivity and the end of the demographic winter.
For investors, balancing each of these factors has been akin to undoing knots in a ball of wool. Most of the work has been done, the final thread to be unknotted will be a sustainable decline in mortgage rates. This may just have begun.


